Please separate orchestration and execution (Or: Packaging hell is dragging ML)
Machine Learning's hellish developer experience and research-to-production drag are largely due to widespread over-packaging - coupling systems rigidly together through misuse of containers and pipelines. There's finally an end in sight.

CEO @ 🏃♀️Runhouse🏠
Contents
- First, can we stop pretending ML development is fine?
- A Path Forward: Splitting ML infra into what and how
- Orchestration vs. Execution (vs. whatever containers are)
- What goes wrong when we couple orchestration and execution
- Ok, so what should the infrastructure actually look like?
- Which is why we built Runhouse
- What now?
First, can we stop pretending ML development is fine?
I have too many conversations with ML engineers about infra overhead which proceed like this: They say things are fine, it took some time to determine their execution flow but now it works. I ask how they execute their in-progress ML code. They say it’s pretty simple, they commit and push to version control, which CD picks up and packages into a new docker container, which then is either submitted to an ML pipeline orchestrator or Kubernetes cluster, which runs when it runs. All together, 45 minutes, 2 hours or more. I ask whether it’s annoying to have to constantly be committing in-progress code into version control, when they really just want to run once to iterate or debug. Then the wheels start turning…
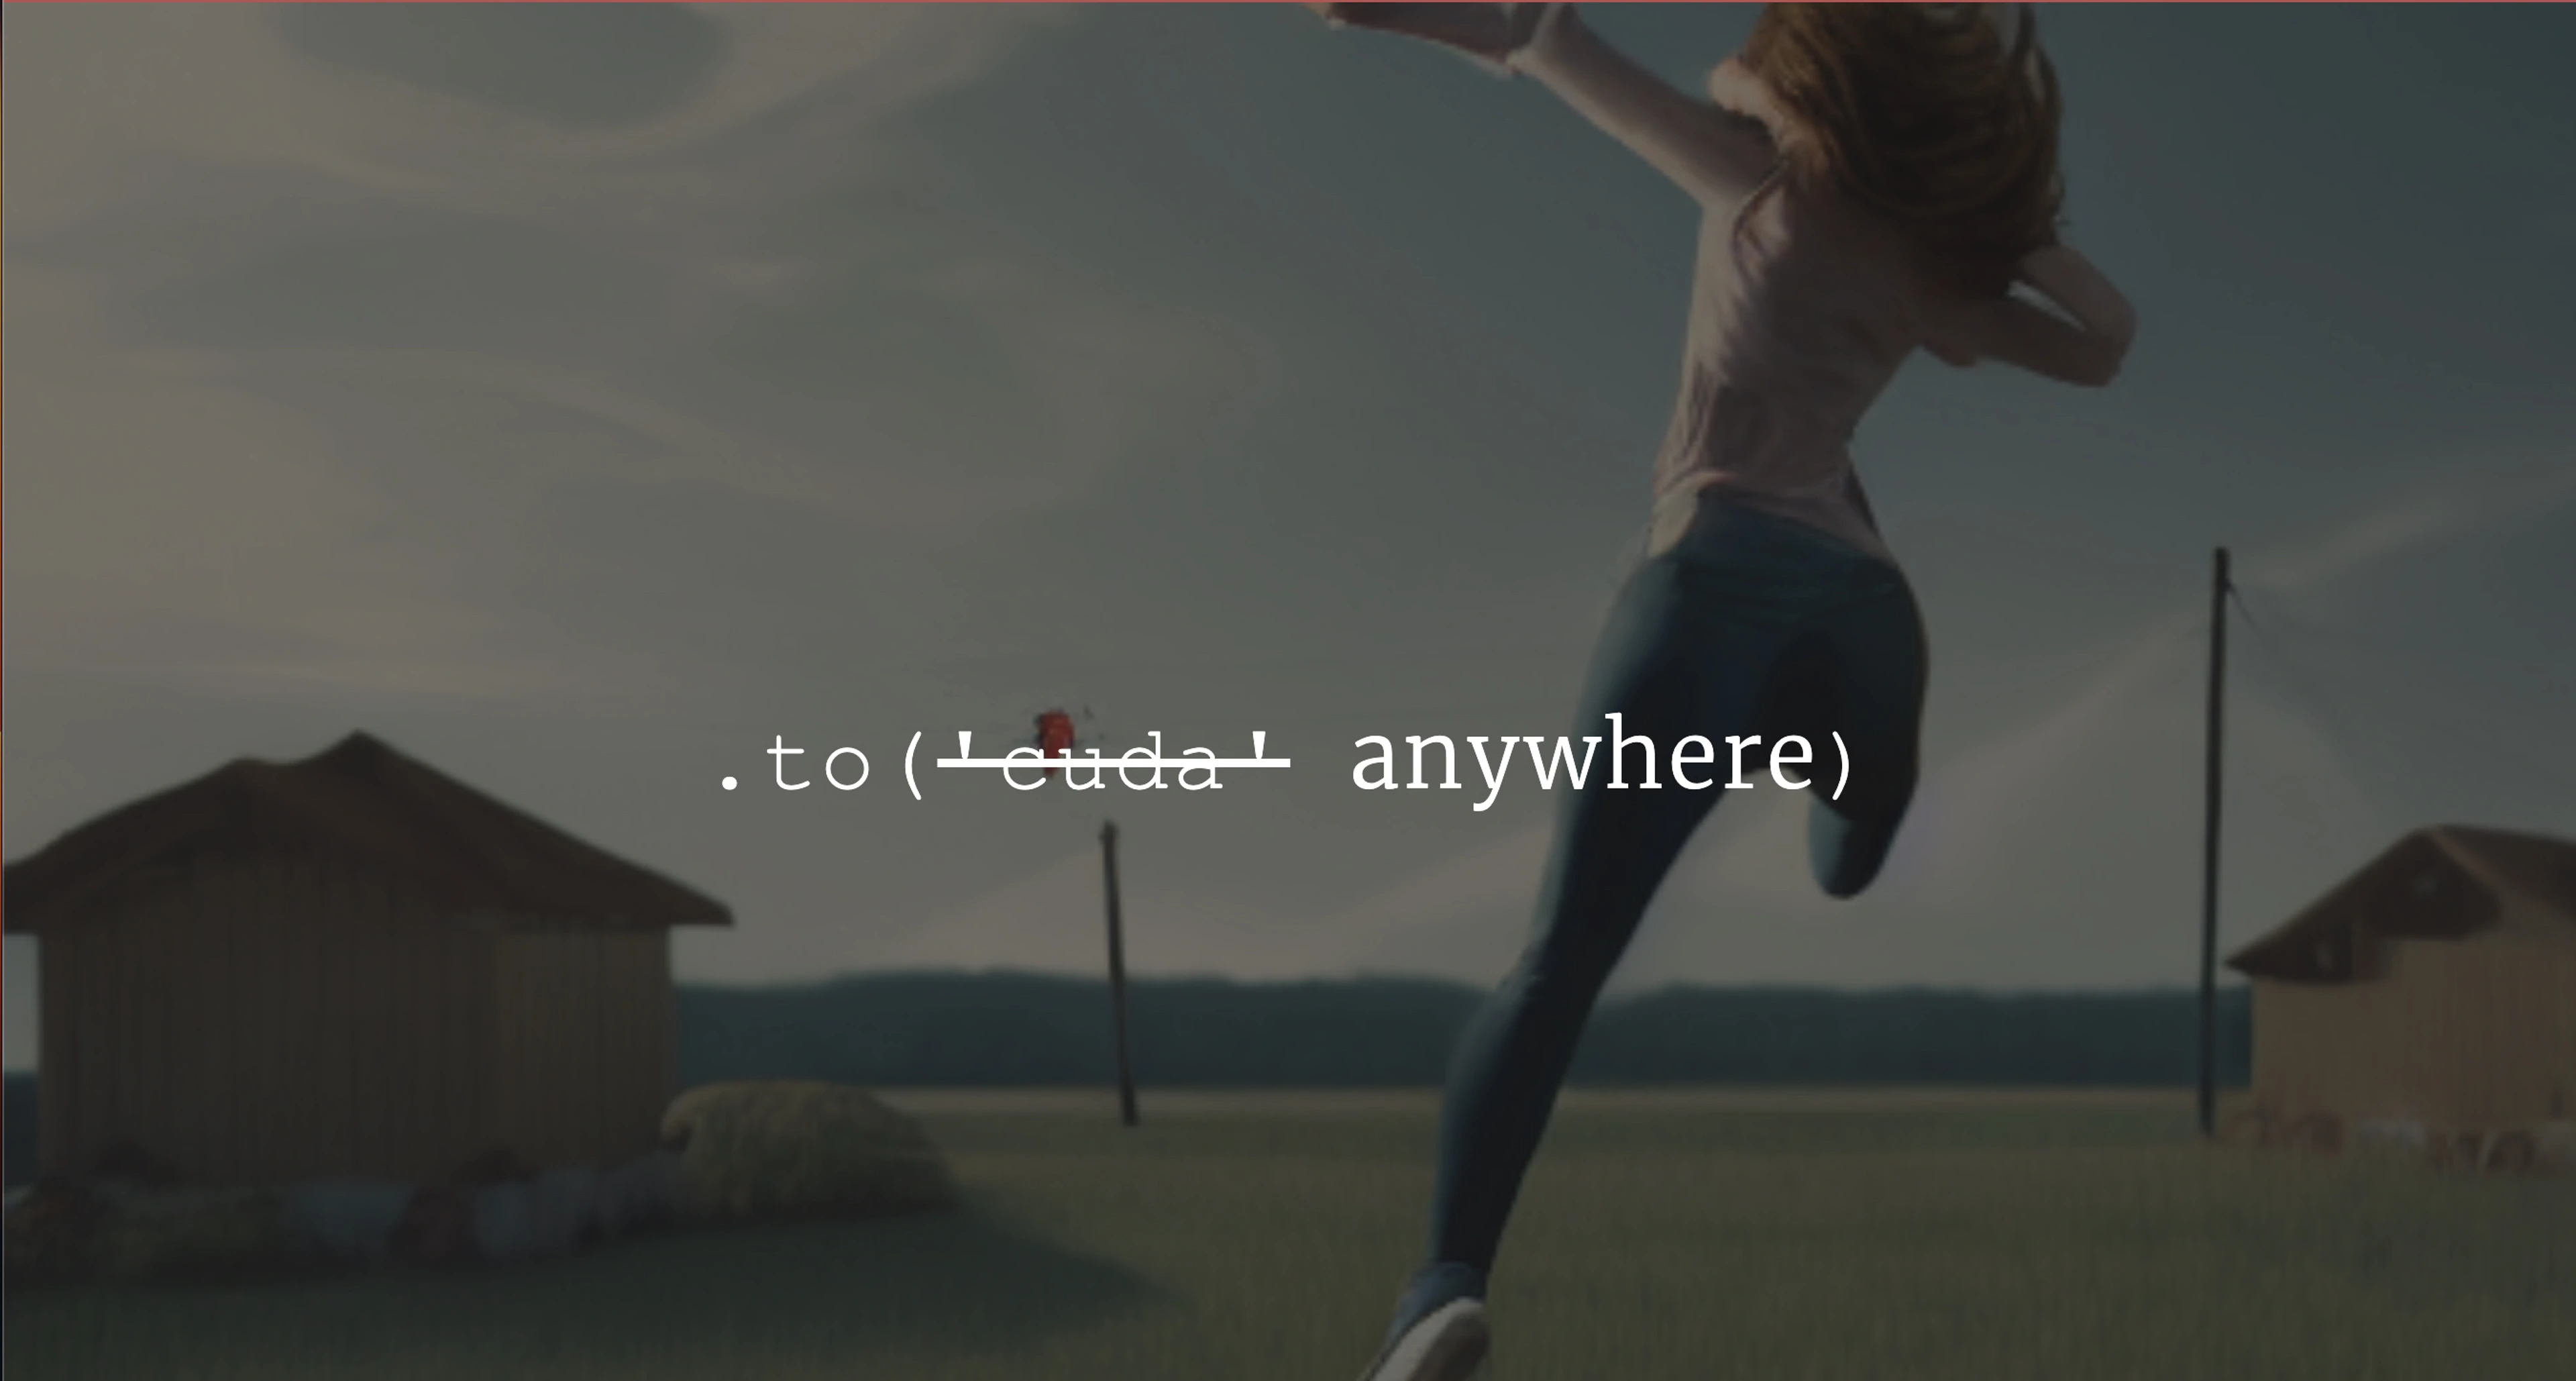
This, plus 10x longer feedback cycles and CUDA errors:

This is not only a matter of DevX or iteration speed, but the velocity of an ML team as a whole. When I point out how poor this dev experience is, and that we should be able to run on our compute directly, I sometimes hear the objection that this packaging process is crucial to “maintain separation between dev and production!” That’s why it takes an hour or two to add a print statement, and 3-6 months to package their research or iteration code for production by translating it into containers and ML pipelines.
The rest of the development world relies on staging - flags and canaries - to flip from dev to QA to prod. This versioning is a *human* decision of quality and readiness, not some abstract matter of “prod-iness” of the code based on how much it’s packaged. The above misunderstanding, conflating packaging with release staging, was baked into the design of the 2018-2022 MLOps wave as an implicit suggestion that “research to production” meant a march from “unpackaged to packaged.” Yes, many ML teams have some semblance of staging. Some use versions in a model registry like Sagemaker’s, Weights & Biases’, or MLFlow’s to have this control if only for model inference services, but leaving the question unanswered for virtually everything else. Some attach dev, QA, and prod tags to hacky config files in MLFlow or Weights & Biases which point to the commit, dependencies, and or data sources which define that version of an artifact or service. Most are relying on the implicit conversion of code into containers or MLOps DSLs - ML pipelines, inference services, feature store queries - to define production. There is no mystery “research-to-production” slowdown. It’s packaging, and doing all future work on that code through the packaged form. The mystery is why we still even talk about it.
Packaging, in both the individual and team velocity breakdowns above, is not a problem in and of itself. Containers and pipelines are crucial in modern ML. The problem is when we over-package in a way that strongly couples our systems together. And it’s a sick joke that many of the peskiest situations in ML - PyTorch CUDA debugging, exporting models for serving, and distributed training setup - smell like problems that should be solved with more Docker. Luckily, there’s a clear way to draw the line so we can use packaging at its best, and leave the DevX and team drag behind.
A Path Forward: Splitting ML infra into what and how
I’ve written in the past about how we got here and why ML’s de facto packaging approach, docker+pipelines, doesn’t make ML or distributed code as idempotent as once advertised. I think we can all agree that the days of claiming that wrapping things in docker containers and ML pipelines allows you to run your code locally and then ship it anywhere were hilarious and behind us. Now I’d like to talk about the path forward for ML infra - separating the concerns of orchestration from execution - and why this shift is already well underway.
Orchestration specifies “what” should happen, the individual components of an ML pipeline or the steps a Kubernetes cluster takes to return to homeostasis (NB: I’m noting how the container orchestrator view of K8s fits here for completeness sake, but very few ML teams I know actually use it in this way. Most simply use it as “place to run things,” so that’s how we’ll treat it from now on). For example, the "what" may be "run the prod BERT fine-tuning with the prod pretrained checkpoint on this hour's preprocessed user comment data". Execution, which happens in the infra, defines "how" something should happen - exact the compute, code (down to the commit), dependencies, environment, data artifacts, etc. to complete the task. This may be "the prod BERT fine-tuning is the training.ft_bert_lora method in the nlp_team git package, running on the nlp_A100 Docker image on 4 A100s in the ml_infra Kubernetes cluster." Note that the execution itself may be the higher-order system relative to something else, e.g. the what is using the nlp_A100 container image, but the how contains the exact name, version, and container store URI.
Separating orchestration from execution means unbundling what you want a system to do with how you want it done. Despite solving the packaging problem, it doesn’t mean doubling back on our Docker containers, pipelines, or MLOps tools. Rather, it means when a higher-order system, like a pipeline, calls into a lower-order system, like some training code in a Docker container on a Kubernetes cluster, that we should use a versioning system between them to decouple and independently control the implementations. In concrete terms, put as little code into your pipeline nodes as possible, and simply call out to wherever your actual ML code is executed. A versioning system, not unlike the dev/QA/prod staging systems, gives us a live, minimal, togglable, global source of truth for the implementations and infra underneath our artifacts and calls, and keeps record of the causal relationships and lineage between resources, down to exact versions. The benefits are fourfold:
- Iteration, Debugging, and R2P Speed - Being able to directly modify and version the executing code rather than constantly rebuilding, redeploying, and debugging containers.
- Sharing and Reproducibility - Having your ML pipelines use the same underlying service or resource introduces a guarantee of reproducibility beyond each just running the same code (including glue code!) in their own containers.
- Incident Response / Manual Execution - When you need to quickly unblock something, trying to coax containers in a DAG to perform the one-time execution you need is not fun.
- Lineage, Governance, & Management - When all you can record at the site of execution or after an artifact is created is that an opaque container ran, you know almost nothing about its provenance, and you know little about traffic patterns overall (e.g. how many times did people run the BERT fine-tuning? Which teams?).
Orchestration vs. Execution (vs. whatever containers are)
It’s important to be precise about what orchestration and execution are, where containers and versioning fit, and the recent developments in this story.
Your orchestrator is designed to decide which task to run, i.e. a semantic specification layer. These “whats” which are relatively stable day to day, even as the underlying methods or infra change, and can be browsed as a sort of “heartbeat” of an organization. Changing or A/B testing the implementation underneath some orchestrated task does not need to change the orchestration logic itself in any way, and this is a major asset. When I tweak my video preprocessing method, I don’t need to change any flows which include “do video preprocessing here,” and when I do change the flow logic itself, it’s a notable event and should be clearly visible. Orchestrators can look more like cron pipelines or event queues, but they still fundamentally specify “whats.” They are very good at surfacing and handling failures, enforcing dependencies between tasks, and striving to maintain certain rules of state in a broader system. Note that your orchestrator does not have a complete view of your infra, as many executions can happen and artifacts are created outside of orchestration, nor the global graph of relationships between artifacts and executions, as the activities within the tasks are generally opaque to the orchestrator itself. Sometimes an orchestrator asks its users to tag the artifacts which are created at each stage to help construct lineage, but this is a voluntary activity for its own sake.
Execution is the set of concrete services, jobs, and data artifacts which live on your compute and storage infrastructure. We’ll generally refer to the compute infra, i.e. places where code can be sent to execute, as “clusters” (despite it being a very overloaded term, I don’t know a better one), meaning a compute resource with some kind of submission entrypoint and a scheduler. A single box or serverless engine can be a cluster. Your world of compute consists of all these clusters, places where you can send jobs or code to execute, and perhaps have varying levels of formality and rigor to their scheduling system (even if just an OS). It’s important not to mix up the “dispatch” that can happen within a cluster (e.g. distributing work to workers) with the dispatch of code or jobs to the cluster entrypoint (e.g. from a higher-order system).
The most common cluster type discussed in this context is Kubernetes. When we think of K8s as a place to “send code for execution,” today that generally means packaging it into a container to run on the cluster. The execution Kubernetes supports is simultaneously quite heterogeneous, ranging from one-off jobs to long-lived services, but also very homogeneous, viewed in a different way as a barrage of opaque containers. This means visibility and management are simultaneously quite rich, being that k8s already has such tooling built-in, but also quite bare, as the parade of containers is mostly devoid of relationships and semantic meaning. For a long time, the packaging step has been painful to do manually and was handled by pipeline orchestrators or CD, and the act of turning something like distributed training code into a coordinated activity across containers remains an artisan craft.
Enter Ray, a new kind of cluster scheduler which operates on native Python functions and objects rather than containers. It’s easy to see this as a “cluster” alongside K8s which can have work sent to it, but is usually used in a totally different way. Ray essentially gives us a DSL for specifying distributed execution within a program, making it possible to write distribution in the research stage which is portable to production, and eliminating much of the pain of distributed activities across containers. In this model, a researcher starts their work by creating a fresh Ray cluster, iterates on their code, and usually takes it down at the end of a work session. When they push the code to production in an ML pipeline, the node creates a Ray cluster (usually pulling it out of K8s), runs its work, and then releases the cluster. A number of big-name companies have adopted this model, and I consider Shopify’s Merlin to be a prototypical and well documented example. Ray can also be used to schedule work within a single instance or group of instances, but usually this is mediated behind a simple server on that cluster which essentially uses Ray internally. So you shouldn’t look at Ray and think “oh, here’s my system for dispatching jobs to compute from orchestration” because no one I know of maintains a big long-lived Ray cluster like a K8s cluster, but rather as a much better language in which to actually write the programs, which still need to be sent to compute for execution. The direction of Ray’s own tooling (notably Ray AIR, the ML tooling built on Ray Core), is consistent with this usage pattern.
A note on containers: Your docker containers are designed to cache the environment setup in which your code runs, including compilation if you’re working in a compiled language. If you use them, as many do in ML, as a parcel of scripted (e.g. Python) code to be executed, maybe even with a light yaml or CLI config interface - you’re probably going to have a bad time. For one, these containers are heavy, often a few GB in ML, and take time to build and ship around. Doing that hundreds of times per project seriously adds up, compared to say, having a base container and dropping your code into it with whatever changed. Taking the view of the container as a cache for environment setup, by building a new container for every commit you’re essentially “cache-missing” 100% of the time you change your code slightly. You end up, like many do, with a sea of containers which are, again, practically opaque from the outside. Not fun for reproducibility after all. Debugging code in these containers after throwing them at k8s is also a nightmare, especially when the issues arise from subtle misalignments between the code inside the container and the hardware it was dropped on in the cluster, e.g. the machine image that hardware was started with, and/or the GPU drivers, and/or the GPUs themselves, and/or the inter-GPU communication. You can tell yourself you’ll freeze your dependencies to avoid this debugging at your own peril (what OSS code and models could you use today if you froze your dependencies in mid-2022?). I think most of us could be changing our docker images far less in ML, and instead have a few shared images maintained well and updated over time.
What goes wrong when we couple orchestration and execution
Looking back at the state of the art, which couples orchestration and execution by packaging code into the orchestrator, often inside docker images, we see a slew of failures.
It’s important to note that this is not in any way a knock at orchestration. Orchestration is crucial for specifying complex jobs and dependencies, fault tolerance, observing failures, and more, and over time (some) have become highly ergonomic and loved by their users. Our friends at Prefect are aligned that they don’t want to be mediating execution because it’s not appropriate to bundle it into the pipelines proper.
Iteration, debugging, and R2P speed
With the code packaged into the orchestrator node, execution is gated on orchestration or packaging, which means iteration loops are in the order of hours rather than seconds. Debugging channels are much narrower, with SSH perhaps being inaccessible, and collecting logs and stdout is trickier. Translating notebooks into pipeline and container packaging is a well documented pain that we’ve discussed above. But more dramatically, any change within the how of the underlying pipeline’s execution means a change and new version of the pipeline. There’s no isolation in versioning between a change to the semantic specifics of the pipeline (i.e. what is being done) and the execution specifics (e.g. insert a log statement). It’s all bundled together into a massive list of pipeline versions. If you change your text preprocessing logic, which is imported and used in dozens of pipeline nodes, then you may have new versions of all of those pipelines, or worse, different implementations bundled into each. This is the kind of thing that doesn’t seem to matter until it does, when a downstream artifact starts behaving differently or you need to rollback a pipeline due to an incident. And good luck trying to A/B test a change to that text preprocessing function. Even if you’re using Ray as the distribution DSL, you’re still packaging the code into the orchestration node, with the same implications on iteration times and change versioning.
Sharing and Reproducibility
When the execution is bundled into the orchestration, very little is truly shared. Your nodes always contain glue code around the reusable parts, which means you’ll have dozens of pipelines with a “text preprocessing” node, but they all have slightly different behavior and/or may produce slightly different artifacts (which of course can’t then be shared). Those nodes might actually be on different hardware, and further, everyone running that code outside of an orchestrator is likely on different hardware too, trying their best to estimate the production environment. Reproducibility suffers, sharing suffers, it’s all lots of duplication and Wario reproductions across environments and teams. Compare that to having all of those pipelines and researchers just calling a shared prod text preprocessing service.
This is all not to mention the fact that any “caching” a pipeline does of artifacts is only cached within that pipeline. There is no global shared cache like in the DAG of artifacts in a system like dbt.
Incidents / manual execution
Often the best-conceived MLOps systems are the most rigid and annoying when you’re frantically trying to get a customer unblocked, handle an incident, or do something one-off. The “fault tolerance” of ML pipelines is nice until the thing which caused the failure requires a slight change to the pipeline to complete. Then you’re servicing a car through the tailpipe. If you could just run the blocking underlying step directly with your modifications, or quickly fork it and rerun the pipeline with an altered version, you’d never have this issue. If your execution is bundled into the pipeline itself, good luck.
Lineage
Many ML Engineers I speak to about lineage say “ya, we have lineage,” referring to “looking at the pipeline which generated a resource.” That’s not lineage at all. Some engineer wrote that pipeline, and the pipeline is no more “lineage” than if that engineer described the sequence of events into a Google Doc. Lineage is knowing the provenance (who, where, how) for an arbitrary resource (including previous versions), and being able to follow its dependency trail of upstream artifacts and executions (with exact code versions) across pipelines and even manual operations. Your orchestrator does not have comprehensive lineage because it can only see the things which happen in its workflows, and further, it probably can only see each step as a container, it has no real idea what’s happening inside. Your experiment manager probably doesn’t have it either, only a record of the executions you choose to record (I see people go as far as snapshotting their entire codebase over and over in blob storage with each execution to keep some semblance of breadcrumbs - good luck diffing those if you have an incident!). There are Python DSLs where you change your code into a pipeline in some way to record lineage, but again, those are volunteer efforts, and your graph of resources is only very good if you’re not missing many crucial links in the chain. Traditional data lineage tools track at the storage layer, and therefore have no capacity to answer basic questions like, “which model was used to generate this column of embeddings?”
Lineage needs to be traced through the versioning system and ideally at the points of execution themselves. You need to be able to say “the prod pretrained BERT service (version xxxx) uses the prod pretrained BERT checkpoint (version xxxx), which was trained with the prod (version xxxx) BERT pretraining service, yesterday’s preprocessed user comment data (version xxxx), and the preprocessed common crawl dataset (version xxxx)” etc. By being at the points of execution, you’ve got 100% coverage of the activities that generate new resources and versions, and by being inside the versioning system, you’ve got a semantic understanding of resources and relationships.
Visibility & Usage Management
The “parade of containers” model of execution also makes it very difficult to answer questions like, “How many times this month was my team’s BERT embedding service used by other teams? Which teams?” You need to build that tracking yourself throughout your stack if you want it. And if you’re trying to optimize or load balance the executions on a cluster, good luck doing that by looking at the containers coming in. Sometimes people object to the notion that engineers and researchers should be able to call services or jobs on the compute infra directly (rather than through a notebook in a sandbox where their shenanigans belong!) because what if they disrupt another production job on the cluster with the resources they consume? Well, what if a second production job consumed some resources and did the same thing? Wouldn’t it be easier if these weren’t just “jobs” but rather “2 BERT fine-tunings, one from x team and one from y team, and a production ResNet50 embedding service” which could be load balanced directly? I see lots of unused compute because teams have no way to do real resource management beyond hoping to schedule things at different times of day, or hoard the cluster to keep other jobs out.
Ok, so what should the infrastructure actually look like?
Your execution should be in a place where you can iterate easily, interact with the cluster from elsewhere, and can have a single interaction point which can track all lineage (in ML, it’s more important to track lineage on the cluster where the artifacts are generated than at the storage destination!). Your orchestration nodes should be very lightweight, with most nodes simply calling out to shared microservices which execute the work itself. In principle, any code which is likely to change more often than the semantic specification of the orchestration itself probably shouldn’t be in the orchestration proper. Certainly anything shared by multiple people or pipelines should live outside the orchestrator. If you have a “BERT fine-tuning” node which is used by a number of researchers and pipelines, it would probably be reasonable to put it in a light cpu-only microservice with the glue code, which itself calls a shared training function service on a GPU box.
Which leads to the first reason most teams don’t already do this: Microservices are kind of annoying. You just wrap things over and over in FastAPI, Nginx, and/or containers, and they end up having their own debugging pains. Calling a microservice over HTTP is only slightly better for debugging and iteration than calling your code in orchestration, and maybe worse if you’re starting with a Python function and need to convert a bunch of your inputs and outputs to be JSON-able. Features like streaming (i.e. generators), auth, or propagating logs are annoying and need to be built for each one. There are systems to make building and deploying APIs easier, but in many cases they’re built around non-ML use cases and don’t support diverse hardware (e.g. AWS Lambdas), or are fully hosted and won’t work for existing compute infra (e.g. Modal, Banana, etc.).
The second reason most people don’t do this is that if you’re debugging or editing a pipeline, it’s much too easy to quickly sneak things into orchestration nodes rather than make them shared resources. I see engineers really struggle with this at times - they want their orchestration nodes to feel modular and reusable, but there’s some one-off code they need to add to one pipeline which just doesn’t fit. I can’t tell you how many times I’ve seen someone spend an extra week rethinking how they slice their code to run on each node.
Which is why we built Runhouse
We feel that if building, sharing, and instrumenting a shared service required no more effort than writing the function in the first place, and features like streaming logs/stdout, generators, and async were supported out of the box, this decision would be obvious for most teams. Further, if we can make these functions-turned-services accessible, iterable, and debuggable in Python, without any need to learn about packaging or conform to infrastructure DSLs, most people would choose this interface into the infra for both their research and production work. This is the inspiration for Runhouse OSS, a unified interface into your infrastructure, designed to be aggressively DSL-free and work with your existing Python code. From anywhere - a local script, notebook, orchestration node - you can write experiments and pipelines which traverse any of your compute infrastructure, without ever having to wrap your code in a docker container or package it for particular infra.
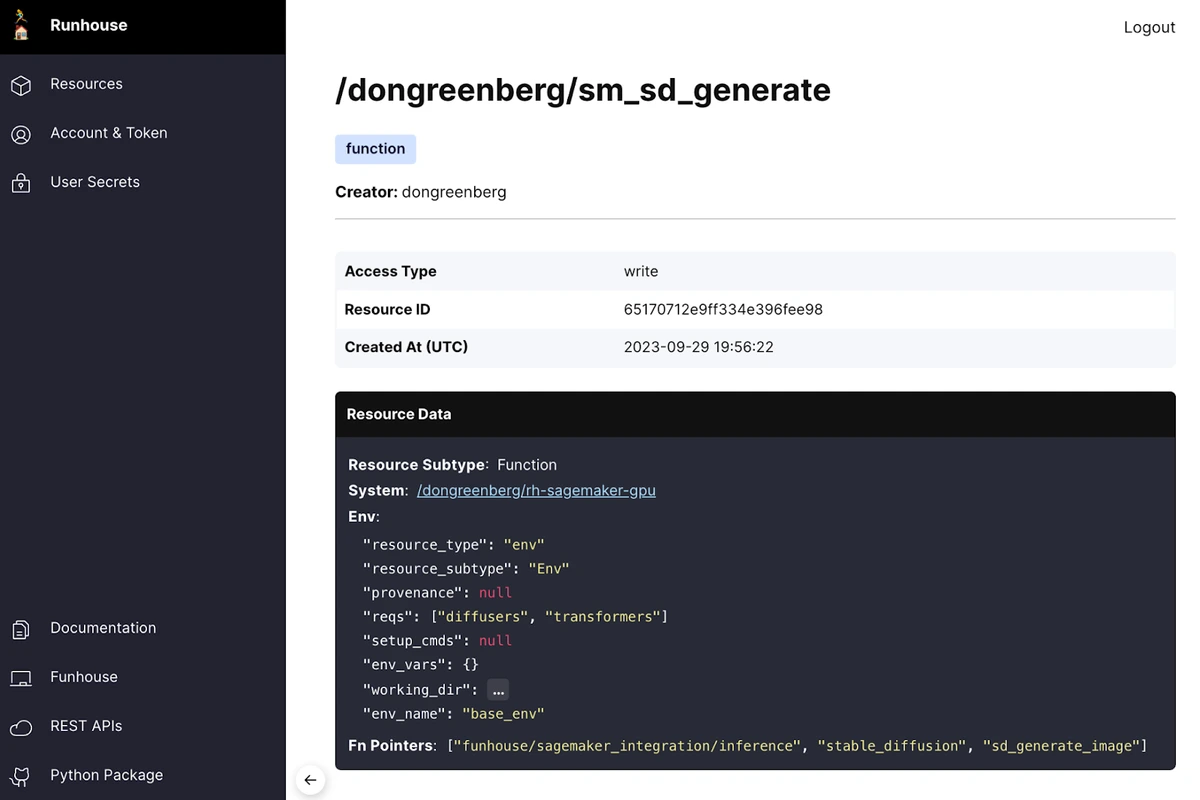
Here’s a Hello World example of sending arbitrary code (in this case loading Stable Diffusion and running inference) to arbitrary compute (in this case, a fresh auto-scaling A10G in SageMaker). This function could be anything in my experiment or pipeline - training, preprocessing, hyper-parameter tuning, whatever - and I don’t need to package it up, refactor it, or “submit it for execution.” Once Runhouse sends it to my choice of compute infrastructure, I call it like a normal function. If I change it and rerun this script, the changed code is synced over via my `.to` call without even stopping the HTTP server on the cluster. It’s really a normal development loop, but I’m running on the real compute this code is meant for, not in a phony local environment.
import runhouse as rh
from diffusers import StableDiffusionPipeline

def sd_generate_image(prompt):
    model = StableDiffusionPipeline.from_pretrained("stabilityai/stable-diffusion-2-base").to("cuda")
    return model(prompt).images[0]


if __name__ == "__main__":
    sm_gpu = rh.sagemaker_cluster(name="rh-sagemaker-gpu",
                                  instance_type="ml.g5.4xlarge",
                                  profile="sagemaker")
    sd_generate = rh.fn(sd_generate_image).to(sm_gpu, env=["./", "diffusers", "transformers"])
    img = sd_generate("A hot dog made out of matcha.")
    img.show()

That’s only half the story, because if I deployed the code above into a pipeline, I’m still coupling the orchestration and execution. That’s why Runhouse also contains a resource versioning system called Runhouse Den, which allows you to save, load, share, and manage your resources. I can call on the cluster or function above (after giving it a name), which persists its how information to Den:
sd_generate.save("sm_sd_generate")
Now I can reload this microservice from anywhere with a single line. Note that the config being loaded which points to this microservice also includes the compute that it’s defined to run on (“rh-sagemaker-gpu”), which autoscales to zero. That means that it can autostop after a period of inactivity, but next time someone calls this function (or another defined on this cluster), it has enough information to relaunch the compute, environment, and service from scratch. Runhouse can do this for AWS, GCP, Azure, Lambda Labs, and SageMaker, and also supports static (e.g. on-prem) instances and Ray clusters.
gen_fn = rh.function(name="sm_sd_generate")

I can use it from inside an orchestrator, such that the how of the microservice (the hardware it runs on, the dependencies, code, or even git commit) is completely decoupled from the what:
from prefect import flow, task
import runhouse as rh


@task
def sd_generate(prompt: str):
    gen_fn = rh.function(name="sm_sd_generate")
    img = gen_fn(prompt)
    return img


@flow(retries=3, retry_delay_seconds=5, log_prints=True)
def generate_image():
    img = sd_generate("A house made of pudding")
    img.show()


if __name__ == "__main__":
    generate_image()

I have complete control over the service and infra behind the name “sd_sm_generate,” and swapping out the function or infra underneath is as easy as a flag flip. Don’t worry, I can control who has read or write access to the resource config and view previous versions:
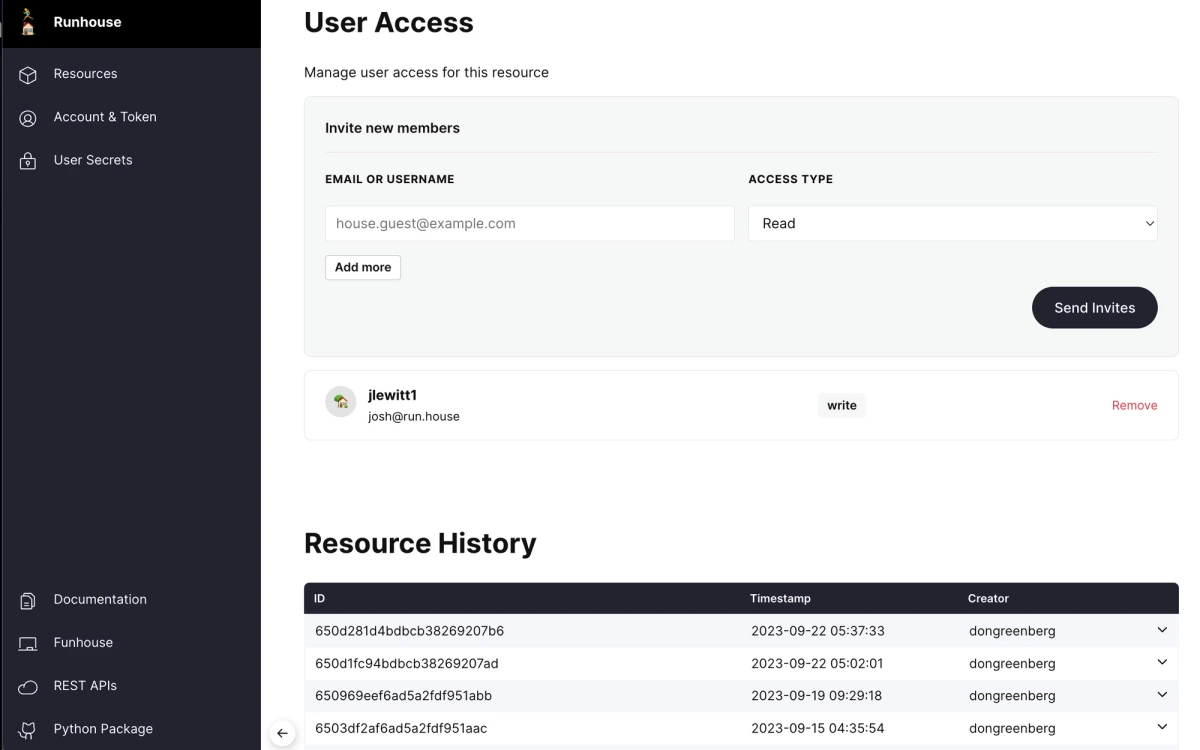
I can even track resource usage:

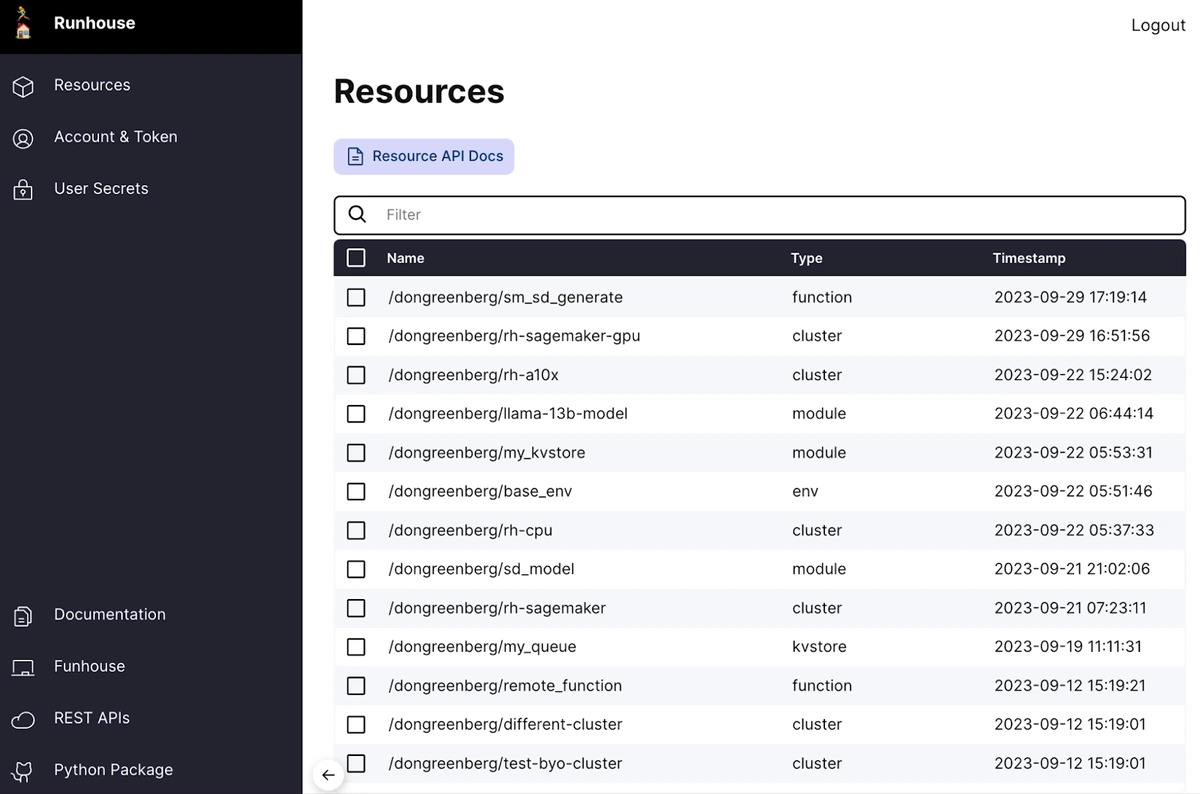
And easily browse mine and my teams’ resources.
What now?
We’ve designed Runhouse to work inside your own infrastructure, accounts, and code, without special auth or permissions, so it can be as easy as possible to pick up and try this experience for yourself. If you’d like some help using it or you’re just interested in understanding how this model fits into your stack, whether you’d like to use Runhouse or not, please do reach out (first @run.house, or our discord, or book time here).
If you support this direction for ML and you’re simply looking to flip a bit in the universe to indicate as much, might I suggest a Github star?
I understand that right now the thing you’re desperately trying to unblock is more likely a chatbot which is butchering your API docs than the lack of lineage or direct programmability of your ML infra. But many of the complaints I hear about packaging resonate from a deeper place: “I didn’t go into ML to debug docker images and Airflow.” I hope you ask yourself questions - Why am I waiting so long to run my code? Shouldn’t this node be a shared service that researchers and pipelines both call? Why can’t I see exactly how that artifact was created? Are there other teams that could be finding and using my work? I hope these lead you to try writing your first orchestration node which calls a shared service, and it feels like you’re not landing months of work in a container you’re excited to forget, but rather creating a new brick in a shared foundation of ML resources.
Thanks to Tullie Murrell, Flaviu Vadan, Jeremiah Lowin, Priyanka Somrah, 🏃♀️Caroline🏠, and 🏃♀️Denis🏠 for helpful conversations and feedback on this monstrosity.
Stay up to speed 🏃♀️📩
Subscribe to our newsletter to receive updates about upcoming Runhouse features and announcements.
Read More

Runhouse 0.0.12: rh.Module, Streaming, and too much more
A PyTorch Approach to ML Infrastructure